A Guide to Metrics for Evaluating Machine Vision

Metrics play a vital role in assessing the performance and reliability of any metrics machine vision system. They provide a structured way to measure how well a system identifies patterns or detects objects. Without metrics, you cannot determine whether a model meets the requirements of its intended application.
For example, metrics like Mean Absolute Error (MAE) and Mean Squared Error (MSE) help you evaluate prediction accuracy within a metrics machine vision system. Others, such as R-squared and Adjusted R-squared, reveal how well the model explains data variability. Each metric provides unique insights, ensuring a thorough evaluation. Relying on multiple metrics prevents misleading results and supports better decision-making.
By leveraging metrics, you gain clarity on system performance, identify areas for improvement, and make informed choices that enhance real-world outcomes in your metrics machine vision system.
Key Takeaways
- Metrics are important for checking how well machine vision works. They show if systems meet the needs of their tasks.
- Use several metrics like accuracy, precision, and recall to understand performance. Using only one metric can give wrong results.
- Common metrics like IoU and mAP help compare models fairly. This matters in competitive areas like computer vision.
- Pick metrics based on what your system needs. For example, focus on recall in safety systems to catch more problems.
- Check and update metrics often to avoid overfitting. This keeps your machine vision system useful in real-world situations.
Overview of Evaluation Metrics
Purpose of Metrics in Machine Vision
Metrics help you measure how well a machine vision system performs its tasks. They provide a way to quantify success, whether it’s identifying objects, classifying images, or detecting patterns. Without evaluation metrics, you wouldn’t know if your system meets the requirements of its application. For example, metrics like True Positives (TP) and False Negatives (FN) show how accurately your system detects objects. These metrics highlight strengths and weaknesses, guiding you toward improvements.
Using metrics also ensures consistency. When you evaluate different models, metrics let you compare their performance objectively. This helps you choose the best model for your needs. Whether you’re working on computer vision for autonomous vehicles or quality control in manufacturing, metrics are essential for reliable results.
Categories of Metrics: Classification vs. Object Detection
Evaluation metrics fall into two main categories: classification and object detection. Classification metrics measure how well your system assigns labels to images. Common metrics include accuracy, precision, and recall. For example, accuracy tells you the percentage of correct predictions, while precision focuses on how many of the predicted labels are correct.
Object detection metrics, on the other hand, evaluate how well your system identifies and locates objects within an image. Metrics like Intersection over Union (IoU) and Mean Average Precision (mAP) are widely used. IoU measures the overlap between predicted and actual bounding boxes, while mAP provides an overall score for detection performance across multiple object classes.
Here’s a quick summary of key metrics:
| Metric | Description | Range/Effectiveness |
|---|---|---|
| True Positives (TP) | Correctly identifies an object. | Indicates model's ability to detect objects accurately. |
| False Positives (FP) | Incorrectly identifies an object that isn’t there. | Affects precision negatively, indicating false alarms. |
| False Negatives (FN) | Misses an object that should have been detected. | Affects recall negatively, indicating missed detections. |
| Intersection over Union (IoU) | Measures overlap between predicted and actual bounding boxes. | Ranges from 0 (no overlap) to 1 (perfect overlap). |
| Mean Average Precision (mAP) | Average precision across different object classes. | Comprehensive metric for evaluating object detection performance. |
Importance of Standardized Evaluation Metrics
Standardized evaluation metrics ensure fairness and consistency. When you use the same metrics as others in the field, you can compare your results more effectively. This is especially important in competitive areas like computer vision, where benchmarks drive innovation. For example, IoU and mAP are standard metrics for object detection tasks, making it easier to evaluate and improve machine vision systems.
Standardization also helps you avoid bias. If you rely on custom metrics, your results might not align with industry standards. By using widely accepted metrics, you ensure that your system’s performance is both reliable and comparable. This is crucial for applications like medical imaging, where accuracy and consistency can directly impact lives.
Key Metrics Explained
Classification Accuracy: Definition, Formula, and Example
Classification accuracy measures how often your machine vision system correctly predicts outcomes. It is one of the simplest and most widely used evaluation metrics. You calculate it by dividing the number of correct predictions (true positives and true negatives) by the total number of predictions.
Formula:
Accuracy = (True Positive + True Negative) / Total Predictions
For example, imagine a system inspecting 1,000 items on a production line. If it correctly identifies 986 defective items (true positives) and 8 non-defective items (true negatives), the accuracy would be:
Accuracy = (986 + 8) / 1000 = 99.4%
This high accuracy indicates that the system performs well in identifying defects. However, accuracy alone may not always provide a complete picture, especially in imbalanced datasets where one class dominates. For instance, if 95% of items are non-defective, a system could achieve high accuracy by predicting "non-defective" for every item, even if it misses most defective ones.
| Metric | Formula | Example Calculation | Result |
|---|---|---|---|
| Accuracy | (True Positive + True Negative) / Total Inspections | (986 + 8) / 1000 | 99.4% |
Precision and Recall: Understanding Trade-offs
Precision and recall are critical performance metrics for tasks like object detection and segmentation. They help you understand how well your system balances false positives and false negatives.
-
Precision measures the proportion of true positives among all positive predictions. It answers the question: "Of all the items the system labeled as defective, how many were actually defective?"
Formula:Precision = True Positive / (True Positive + False Positive) -
Recall measures the proportion of true positives among all actual positives. It answers the question: "Of all the defective items, how many did the system correctly identify?"
Formula:Recall = True Positive / (True Positive + False Negative)
These metrics often trade off against each other. For example, increasing precision by being more selective may reduce recall, as fewer true positives are identified. Conversely, increasing recall by being more inclusive may lower precision, as more false positives occur. This trade-off is crucial in applications like medical imaging, where missing a diagnosis (low recall) can be more harmful than a false alarm (low precision).
Tip: Tailor the balance between precision and recall to your specific application. For instance, prioritize recall in safety-critical systems like autonomous vehicles, where missing an obstacle could lead to accidents.
F1-Score: Balancing Precision and Recall
The F1-score combines precision and recall into a single metric, providing a balanced measure of a system's performance. It is particularly useful when you need to account for both false positives and false negatives.
Formula:
F1-Score = 2 * (Precision * Recall) / (Precision + Recall)
The F1-score represents the harmonic mean of precision and recall, ensuring that both metrics contribute equally. For example, if a system achieves a precision of 0.998 and a recall of 0.996, the F1-score would be:
F1-Score = 2 * (0.998 * 0.996) / (0.998 + 0.996) = 0.997
This metric is invaluable in scenarios where precision and recall must be balanced, such as quality control in manufacturing or object detection in computer vision. It ensures that your system performs well across both dimensions, rather than excelling in one at the expense of the other.
- The F1-score is particularly effective in capturing the interplay between precision and recall.
- It provides a single number that reflects the trade-off, making it easier to compare models.
- Use the F1-score when both false positives and false negatives carry significant consequences.
| Metric | Formula | Example Calculation | Result |
|---|---|---|---|
| F1 Score (GOOD) | 2 * (precision_GOOD * recall_GOOD) / (precision_GOOD + recall_GOOD) | 2 * (0.998 * 0.996) / (0.998 + 0.996) | 0.997 |
IoU (Intersection over Union): Spatial Overlap in Object Detection
Intersection over Union (IoU) is a critical metric for evaluating spatial overlap in object detection tasks. It measures how well the predicted bounding box aligns with the ground truth box. IoU provides a simple yet effective way to assess localization accuracy in machine vision systems. You calculate it by dividing the area of overlap between the predicted and actual bounding boxes by the area of their union.
Formula:
IoU = Area of Overlap / Area of Union
For example, if the predicted box overlaps with the ground truth box by 50 square pixels and their union covers 100 square pixels, the IoU would be:
IoU = 50 / 100 = 0.5
An IoU score closer to 1 indicates better alignment, while a score near 0 suggests poor localization. This metric is widely used in computer vision applications, such as autonomous vehicles and surveillance systems, where precise object detection is crucial.
Tip: Set a threshold for IoU based on your application. For instance, a threshold of 0.5 is common, but higher thresholds may be necessary for tasks requiring greater accuracy.
Practical Applications of IoU
IoU has proven effective in real-world scenarios. Here are two case studies that highlight its importance:
| Case Study | Description |
|---|---|
| CrowdHuman Dataset | Demonstrates the challenges of detecting overlapping objects and the effectiveness of an overlap-aware box selection solution that utilizes IoU metrics. |
| Sports Dataset | Shows improved performance of the proposed method over state-of-the-art algorithms in scenarios with high object overlap. |
Additionally, IoU plays a key role in advanced performance metrics like Localization-Recall-Precision (LRP). For example:
- Localization-Recall-Precision (LRP) evaluates detector performance based on a specific confidence threshold.
- LRP_{LocComp} uses IoU to assess localization errors on true positive bounding boxes.
mAP (Mean Average Precision): Evaluating Detection Performance
Mean Average Precision (mAP) is a comprehensive metric for evaluating detection performance across multiple object classes. It combines precision and recall to provide an overall score for a model's ability to detect objects accurately. You calculate mAP by averaging the precision values at different recall levels for each class and then taking the mean across all classes.
Formula:
mAP = (Σ Average Precision for Each Class) / Number of Classes
For example, if a model achieves average precision scores of 0.85, 0.90, and 0.88 for three classes, the mAP would be:
mAP = (0.85 + 0.90 + 0.88) / 3 = 0.876
mAP is particularly useful in scenarios where detecting multiple object types is essential, such as retail inventory management or wildlife monitoring. It provides a balanced view of detection performance, ensuring that models perform well across all classes rather than excelling in just one.
Note: Higher mAP scores indicate better detection performance. Aim for consistent improvement by optimizing your model's precision and recall.
AUC (Area Under the Curve): Classification Performance
Area Under the Curve (AUC) is a key metric for evaluating classification performance. It measures the area under the Receiver Operating Characteristic (ROC) curve, which plots the true positive rate (recall) against the false positive rate. AUC provides a single score that reflects a model's ability to distinguish between classes.
Formula:
AUC does not have a direct formula but is calculated as the integral of the ROC curve.
An AUC score ranges from 0 to 1, with higher values indicating better classification performance. For example, an AUC of 0.95 suggests that the model can accurately separate positive and negative classes 95% of the time. This metric is widely used in applications like medical imaging and diagnostics, where classification accuracy is critical.
Why AUC Matters
AUC offers several advantages:
- It evaluates performance across all classification thresholds, providing a holistic view.
- It is robust to class imbalance, making it ideal for datasets with unequal class distributions.
Use AUC to compare models and select the one that delivers the best classification results for your machine vision systems.
Choosing the Right Metrics
Metrics for Classification Tasks
Selecting the right metrics for classification tasks ensures your machine vision systems perform effectively. These metrics evaluate how well your system assigns labels to images or objects. Accuracy, precision, recall, and the f1-score are commonly used measurement tools for classification tasks.
Accuracy provides a straightforward way to measure overall performance. It calculates the percentage of correct predictions out of all predictions. While accuracy works well for balanced datasets, it may not be reliable for imbalanced ones. For example, if most items belong to one class, accuracy can give misleading results.
Precision and recall help you understand the trade-offs between false positives and false negatives. Precision focuses on the correctness of positive predictions, while recall measures how many actual positives your system identifies. Balancing these metrics is crucial for applications like medical imaging, where missing a diagnosis (low recall) can have serious consequences.
The f1-score combines precision and recall into a single metric. It’s particularly useful for imbalanced datasets, where one class dominates. For instance, in segmentation tasks, the f1-score ensures your system performs well across both dimensions, making it a reliable choice for evaluating classification tasks.
| Metric | Description |
|---|---|
| Accuracy | Measures the percentage of correct predictions. |
| Precision | Evaluates the proportion of true positives among all positive predictions. |
| Recall | Assesses the proportion of true positives among all actual positives. |
| F1 Score | Balances precision and recall, providing a single measure of performance. |
Tip: Use precision and recall when false positives or false negatives carry significant consequences. For imbalanced datasets, prioritize the f1-score for a balanced evaluation.
Metrics for Object Detection Tasks
Object detection tasks require metrics that evaluate both localization and classification performance. Metrics like Intersection over Union (IoU), Average Precision (AP), and Mean Average Precision (mAP) are widely used in computer vision tasks.
IoU measures the spatial overlap between predicted and actual bounding boxes. It’s simple and intuitive, providing a clear measure of detection accuracy. However, IoU can be sensitive to small variations and may not capture all aspects of detection quality. Setting an appropriate threshold, such as 0.5, ensures consistent evaluation.
AP evaluates precision at various recall levels, offering a comprehensive view of detection performance. It’s particularly useful for tasks requiring high precision, such as autonomous vehicles. mAP extends AP by aggregating performance across multiple classes, making it ideal for complex detection scenarios.
Here’s a comparison of key metrics for object detection tasks:
| Metric | Pros | Cons |
|---|---|---|
| Intersection over Union (IoU) | Simple and intuitive. Provides a clear measure of overlap. | Sensitive to small variations. May not capture all aspects of detection quality. |
| Average Precision (AP) | Provides a comprehensive evaluation at various confidence levels. | Sensitive to the choice of confidence thresholds. May not work for tasks with strict precision or recall requirements. |
| Mean Average Precision (mAP) | Aggregates performance across multiple classes. | Can mask poor performance in specific classes. Sensitive to class imbalance. |
Note: The DyHead algorithm demonstrates the importance of these metrics. For example, its ResNeXt-64 × 4d-101-DCN backbone achieves an AP75 score of 59.3, indicating high precision at stringent IoU thresholds.
Metrics for Quality Control and Industrial Applications
Quality control in industrial applications relies on performance metrics to ensure efficiency and accuracy. Metrics like accuracy, processing speed, and recall play a vital role in evaluating machine vision systems used for defect detection and product sorting.
For example, in the automotive industry, machine learning models predict the location of milled holes in bumper beams. These predictions allow early detection of tolerance violations, enhancing the quality control process. Similarly, integrating computer vision with programmable logic controllers (PLCs) improves industrial automation, optimizing operational efficiency.
Key metrics for quality control include:
- Accuracy: Measures how well your system identifies defects or sorts products correctly.
- Processing Speed: Evaluates the time taken to inspect items, ensuring timely operations.
- Recall: Assesses the system’s ability to detect all defective items, minimizing missed detections.
Tip: Data-driven methodologies help maintain competitive advantages in industrial settings. Use metrics to refine your machine vision systems and improve overall performance.
Factors to Consider When Selecting Performance Metrics
Choosing the right performance metrics for machine vision systems requires careful consideration of several factors. These metrics act as a measurement tool to evaluate how well your system performs tasks like detection, classification, and quality control. To ensure accurate and meaningful results, you need to align the metrics with the specific requirements of your application.
Understand the Measurement Task and Objectives
Start by identifying the exact task your system needs to perform. Whether it’s detecting defects in manufacturing or analyzing images in computer vision tasks, the objectives must be clear. For example, if your goal is to improve recall in a quality control application, you should prioritize metrics that highlight missed detections. Similarly, for tasks requiring precise localization, metrics like Intersection over Union (IoU) become essential.
Evaluate the Test Object and Scene Characteristics
The characteristics of the test object and the scene play a significant role in metric selection. Consider factors like size, shape, and texture of the objects your system will analyze. For instance, high-resolution metrics are crucial for applications involving small or intricate features. Additionally, the scene’s lighting and background conditions can impact the system’s ability to perform accurately. Metrics that account for variability in these conditions ensure reliable performance.
Ensure Consistency in Terminology
When comparing machine vision systems from different suppliers, consistent terminology is vital. Using standardized definitions for metrics like accuracy, repeatability, and resolution helps you make fair comparisons. For example, accuracy measures how closely the system’s output matches the true value, while repeatability evaluates the variability of repeated measurements under identical conditions. Resolution, on the other hand, determines the smallest optical feature the system can distinguish.
| Metric | Definition |
|---|---|
| Accuracy | Degree of conformance between a measurement and a recognized standard indicating the true value. |
| Repeatability | Variability of repeated measurements of the same quantity under the same conditions. |
| Resolution | Smallest distinguishable optical feature, influenced by pixel count, magnification, and optics quality. |
Integrate Metrics with Process Requirements
Metrics should align with the process integration of your machine vision system. For example, in industrial applications, processing speed is as important as detection accuracy. A system that identifies defects but slows down production may not meet operational goals. By detailing the scene and process requirements, you can select metrics that balance accuracy and efficiency.
Use Acceptance Tests for Validation
Acceptance tests provide a practical way to validate your system’s performance. These tests classify machine vision systems based on their ability to meet predefined benchmarks. For instance, in computer vision tasks, acceptance tests can evaluate how well the system detects objects under varying conditions. This ensures that the selected metrics reflect real-world performance.
Tip: Always evaluate the application in detail before selecting metrics. This ensures that the chosen metrics align with your objectives and deliver actionable insights.
By considering these factors, you can select metrics that not only measure performance but also drive improvements in your machine vision systems. This approach ensures that your system performs optimally across diverse applications, from quality control to computer vision tasks.
Practical Applications
Machine Vision in Manufacturing: Quality Control
Machine vision systems play a vital role in ensuring quality control in manufacturing. These systems use high-resolution imaging to detect defects, measure dimensions, and verify product quality. For example, a vision inspection system developed for catheter manufacturing demonstrated how metrics machine vision systems can enhance quality control. This system, validated against traditional methods, met strict statistical requirements and effectively monitored critical parameters. It showed acceptable results for gage linearity and bias, proving its reliability.
The demand for machine vision in manufacturing continues to grow. The global industrial machine vision market is expected to increase from $10.53 billion in 2023 to $18.25 billion by 2031. The quality assurance segment is projected to dominate this market in 2024, driven by the need for rigorous defect detection. Industries like automotive also rely on high-speed inspection systems to ensure final product quality.
Object Detection in Autonomous Vehicles
Object detection is crucial for the safety and performance of computer vision models in autonomous vehicles. Metrics like Intersection over Union (IoU), precision, and recall evaluate how well these systems identify and locate objects. IoU measures the overlap between predicted and actual object positions, ensuring accurate localization. Precision and recall assess the system's ability to detect objects without false alarms or missed detections.
These metrics provide essential data for validating autonomous vehicle systems. For instance, IoU helps determine if a vehicle can accurately detect and position obstacles. This ensures the system meets safety standards and performs reliably under various conditions. Metrics like mean average precision (mAP) and F1-score further enhance evaluation by balancing detection accuracy across multiple object classes.
| Metric | Description |
|---|---|
| Intersection over Union | Measures overlap between predicted and actual bounding boxes. |
| Precision | Ratio of true positives to total predicted positives. |
| Recall | Ratio of true positives to total actual positives. |
| Average Precision (AP) | Average of precision values at different recall levels. |
| Mean Average Precision | Mean of Average Precision across all classes. |
| F1 Score | Harmonic mean of precision and recall, balancing both metrics. |
Medical Imaging and Diagnostics
In medical imaging, machine vision metrics ensure accurate diagnostics and reliable clinical decisions. Metrics like sensitivity, specificity, and AUROC evaluate the performance of computer vision models in detecting abnormalities. However, traditional metrics may not always reflect clinical outcomes. For example, improvements in these metrics do not necessarily lead to better patient care.
A review highlighted the risks of using faulty metrics in medical imaging. It emphasized the need for evaluation standards to ensure reliable results. Metrics like AUROC and sensitivity are commonly reported, but their selection often lacks justification. This underscores the importance of choosing appropriate metrics to improve diagnostic accuracy and patient management.
Retail and Inventory Management: Metrics for Object Tracking
Object tracking metrics play a crucial role in retail and inventory management. They help you monitor stock levels, optimize shelf space, and improve customer satisfaction. Machine vision systems equipped with high-resolution imaging enable precise detection of product movements, ensuring better inventory visibility and reducing shrinkage.
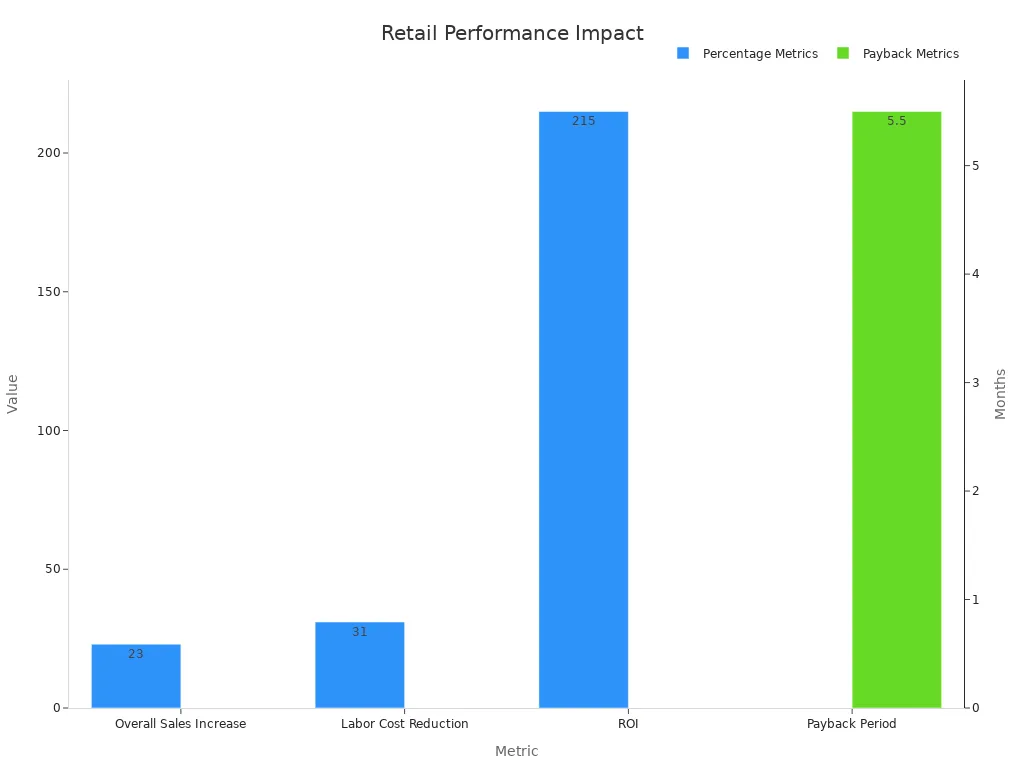
Metrics like payback period, ROI, and enhanced customer experience demonstrate the tangible benefits of object tracking. For example, tracking systems can reduce labor costs by automating manual inventory checks. They also improve vendor relationships by providing accurate data for negotiations. These metrics not only streamline operations but also give you a competitive edge through superior product availability.
Here’s a breakdown of key metrics and their impact on retail performance:
| Metric | Impact |
|---|---|
| Overall Sales Increase | 23% increase across monitored categories |
| Labor Cost Reduction | 31% reduction in manual inventory checks |
| ROI | 215% within the first year |
| Payback Period | 5.5 months |
| Enhanced Customer Experience | Reduced instances of customers unable to find products |
| Improved Vendor Relationships | Better data for strategic negotiations |
| Optimized Merchandising | Better shelf space allocation |
| Reduced Shrinkage | Improved inventory visibility |
| Data-driven Purchasing | Improved forecasting accuracy |
| Optimized Staffing | Better personnel allocation during peak times |
| Enhanced Planogram Compliance | Verification of product placements |
| Competitive Advantage | Superior product availability |
By leveraging computer vision and metrics machine vision systems, you can achieve better quality control and operational efficiency. High-resolution imaging ensures accurate detection of misplaced or missing items, helping you maintain optimal stock levels. These systems also enhance planogram compliance, verifying product placements and improving merchandising strategies.
Tip: Use data-driven metrics to forecast demand and allocate resources effectively. This approach minimizes overstocking and understocking, ensuring a seamless shopping experience for your customers.
Challenges and Limitations
Overfitting to Specific Metrics
Overfitting to specific metrics can limit the effectiveness of machine vision systems. When you optimize a model solely for one metric, it may perform well on that metric but fail in real-world scenarios. For instance, focusing exclusively on accuracy might lead to neglecting precision and recall, which are critical for applications like defect detection or medical imaging. This narrow optimization can result in systems that appear effective during testing but struggle with unseen data or diverse conditions.
Dataset bias further complicates this issue. If your training data is skewed, the evaluation metrics might inflate performance, giving a false sense of reliability. For example, a dataset dominated by one class can lead to misleadingly high accuracy, even if the system fails to detect minority classes. To avoid overfitting, you should use a combination of metrics and ensure your dataset represents real-world conditions.
Misinterpretation of Results
Misinterpreting evaluation results can lead to flawed conclusions about your machine vision systems. Metrics like precision and recall provide valuable insights, but they require careful interpretation. For example, a high recall might suggest your system detects most objects, but it could also mean an increase in false positives. Similarly, claims that machine learning algorithms outperform human performance should be approached cautiously. Methodological biases and incomplete reporting of human participant details often undermine the validity of such comparisons.
Automatic evaluation metrics also struggle to capture human judgment nuances. In tasks like computer vision captioning, discrepancies between machine-generated and human-generated outputs highlight this limitation. You should complement quantitative metrics with qualitative assessments to ensure a balanced evaluation.
Limitations of Metrics in Complex Scenarios
Metrics often fall short in addressing complex scenarios. In real-world applications, defining "goodness" in evaluations can be challenging. For instance, in natural language processing tasks, metrics fail to account for context or subtle variations in meaning. Similarly, in computer vision, metrics like Intersection over Union (IoU) might not fully capture the quality of object localization in crowded or overlapping scenes.
Comparative studies frequently claim superior performance of machine vision systems over humans, but these claims can be misleading. Important details, such as the expertise of human participants or the number tested, are often omitted. This lack of transparency limits the reliability of comparisons and raises questions about the robustness of the metrics used.
To address these limitations, you should combine multiple metrics and consider the specific requirements of your application. For example, in scenarios with overlapping objects, using advanced metrics alongside IoU can provide a more comprehensive evaluation.
Balancing Multiple Metrics for Holistic Evaluation
Relying on a single metric to evaluate machine vision systems can lead to incomplete or misleading conclusions. Balancing multiple metrics provides a more comprehensive understanding of your system's performance. This approach ensures that you address different aspects of the task, such as accuracy, speed, and reliability, without overemphasizing one at the expense of others.
For example, focusing solely on detection accuracy might overlook issues like processing speed or false positives. A balanced evaluation considers these trade-offs, helping you create a system that performs well in real-world scenarios. In computer vision applications, combining metrics like Intersection over Union (IoU), precision, and recall ensures that your system excels in both localization and classification tasks.
The importance of balancing metrics becomes clear when you examine its impact on decision-making and performance. Consider the following findings:
| Evidence Type | Description | Impact |
|---|---|---|
| Quantitative | 70% of executives made strategic missteps due to excessive focus on metrics | Highlights the dangers of overemphasizing metrics |
| Qualitative | 30% increase in employee engagement with qualitative feedback | Shows the benefits of integrating qualitative assessments |
| Combined | 20% increase in decision-making efficiency with integrated metrics | Emphasizes the importance of a holistic approach to performance analysis |
Real-world examples further illustrate this point:
- A tech startup experienced a 50% drop in new product launches after prioritizing KPIs over innovation.
- A Fortune 500 company improved team collaboration scores by 25% after implementing regular check-ins.
- A mid-sized tech company reduced staff turnover by 30% by balancing revenue growth and employee satisfaction.
Balancing metrics also helps you align your system's performance with specific goals. For instance, in a metrics machine vision system used for quality control, you might prioritize recall to minimize missed defects while maintaining acceptable precision. This ensures that your system not only detects issues but also operates efficiently within your workflow.
By integrating multiple metrics, you gain a holistic view of your system's strengths and weaknesses. This approach allows you to make informed decisions, optimize performance, and ensure that your machine vision systems meet the demands of their intended applications.
Evaluation metrics are essential for understanding and improving machine vision systems. They provide a clear way to measure performance, ensuring your system meets its goals. Metrics like classification accuracy, precision, recall, and IoU help you assess tasks ranging from image classification to object detection. For example:
| Metric | Task | Definition |
|---|---|---|
| Classification Accuracy | Image classification | Percentage of correctly classified images over total images in the test dataset. |
| Precision | Object detection, instance segmentation | Ratio of true positive predictions to total positive predictions made by the model. |
| Recall | Object detection, instance segmentation | Ratio of true positive predictions to total ground truth positive samples. |
| F1-score | Object detection, instance segmentation | Harmonic mean of precision and recall, balancing both metrics. |
| Intersection over Union (IoU) | Object detection, instance segmentation | Measures how well the predicted box matches the real object, indicating accuracy of detection. |
By applying these metrics effectively, you can refine your system and achieve better results. Explore these tools further to unlock their full potential in real-world applications.
FAQ
What are the most important metrics for evaluating machine vision systems?
The most important metrics depend on your task. For classification, focus on accuracy, precision, recall, and F1-score. For object detection, prioritize IoU and mAP. These metrics help you measure how well your system performs in identifying, classifying, or detecting objects.
How do you choose the right metric for your application?
You should consider your task and goals. For example, use recall if missing defects is critical, or precision if false positives are costly. Evaluate your dataset and application needs to select metrics that align with your objectives.
Why is IoU important in object detection?
IoU measures how well a predicted bounding box matches the actual object. It ensures accurate localization of objects. A higher IoU score means better alignment, which is crucial for tasks like autonomous driving or surveillance.
Can one metric evaluate all aspects of a machine vision system?
No single metric can cover all aspects. For a complete evaluation, combine metrics like accuracy, recall, and IoU. This approach ensures you assess both classification and localization performance effectively.
How do you avoid overfitting to specific metrics?
Use multiple metrics to evaluate your system. Avoid optimizing for just one metric, like accuracy, as it may lead to poor performance in real-world scenarios. Ensure your dataset represents diverse conditions to prevent bias.
See Also
Fundamentals of Metrology in Machine Vision Technology
Grasping Dimensional Measurement Techniques in Vision Systems
A Complete Overview of Machine Vision in Automation